
First Quarter 2018 Highlights
*For a reconciliation of EBITDA, Adjusted EBITDA, and Adjusted Net Income to Net Income, as well as a reconciliation of Adjusted EPS, see note 2 below.
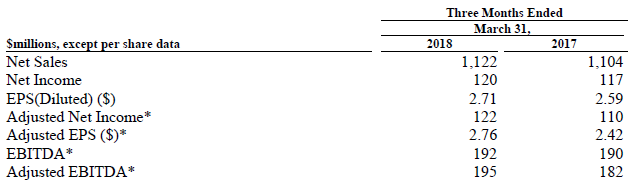
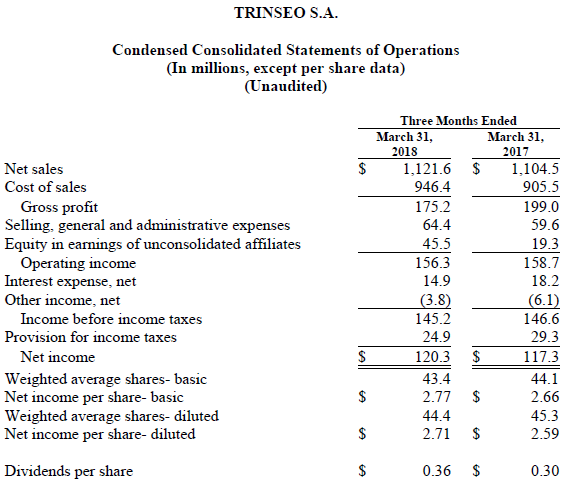
Trinseo (NYSE: TSE), a global materials company and manufacturer of plastics, latex binders and synthetic rubber, today reported its first quarter 2018 financial results, including record profitability, with net sales of $1,122 million, net income of $120 million, and earnings per diluted share of $2.71. First quarter Adjusted EPS was $2.76 and Adjusted EBITDA was $195 million.
Net sales in the first quarter increased 2% versus prior year due to favorable currency, as the euro strengthened in comparison to the U.S. dollar, which had a positive impact across all segments. This impact was partially offset by lower sales volume, primarily in the Latex Binders, Feedstocks, and Synthetic Rubber segments, as well as the pass through of lower raw material costs. First quarter net income of $120 million was $3 million higher than prior year. First quarter Adjusted EBITDA of $195 million was $13 million higher than prior year. The higher profitability was due primarily to higher styrene monomer margins and higher production volume, as the prior year included maintenance outages at the Company’s and Americas Styrenics’ styrene units, as well as currency impacts, as the euro strengthened in comparison to the U.S. dollar. These impacts were partially offset by a favorable net timing impact of $22 million in the prior year, in comparison to an unfavorable impact of $7 million in the current year, as well as lower Adjusted EBITDA in the Latex Binders and Synthetic Rubber segments.
Commenting on the Company’s performance, Chris Pappas, Trinseo President and Chief Executive Officer, said, “We started the year very strong, including record profitability in the first quarter. This performance exceeded our guidance due mainly to additional impacts from unplanned styrene outages, and continued solid results across all segments. We remain on track to deliver on our aggregate $100 million 2016 to 2019 Adjusted EBITDA growth target in Performance Plastics, Latex Binders, and Synthetic Rubber.”
First Quarter Results and Commentary by Business Segment
Effective January 1, 2018, the Company realigned its reporting segments to reflect the new model under which the business will be managed. Under this new segmentation, the Company will continue to report operating results for six segments, four of which will remain unchanged from the Company’s previous segmentation: Latex Binders, Synthetic Rubber, Feedstocks, and Americas Styrenics. The results of its Polystyrene business, which was previously included within the results of the Basic Plastics segment, is now reported as a standalone segment. Performance Plastics, which previously consisted of compounds, blends, and ABS products sold to the automotive market, now also includes the remaining portion of the ABS business, as well as the results of the SAN and polycarbonate businesses. This segmentation change will provide enhanced clarity to investors by concentrating the Company’s more specialized plastics into a single reporting segment, while also reducing complexity as polycarbonate and ABS are the primary inputs into the downstream production of its compounds and blends. Prior period amounts herein have been recast to reflect this new segmentation.
First Quarter Cash Generation
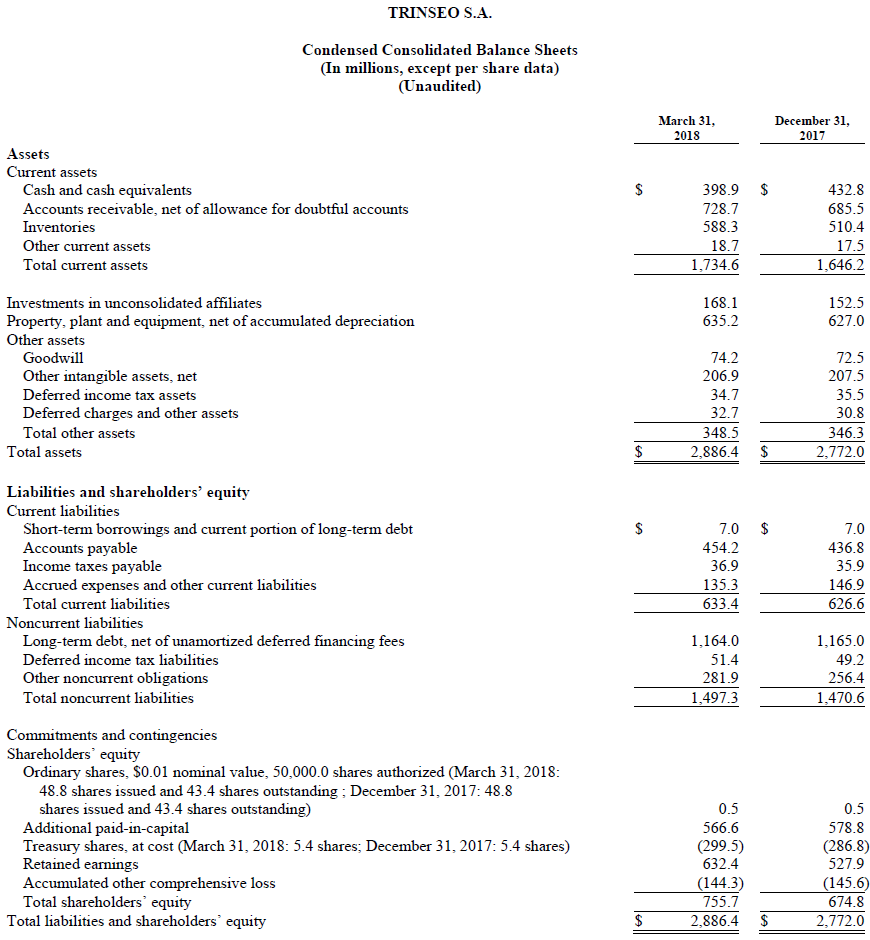
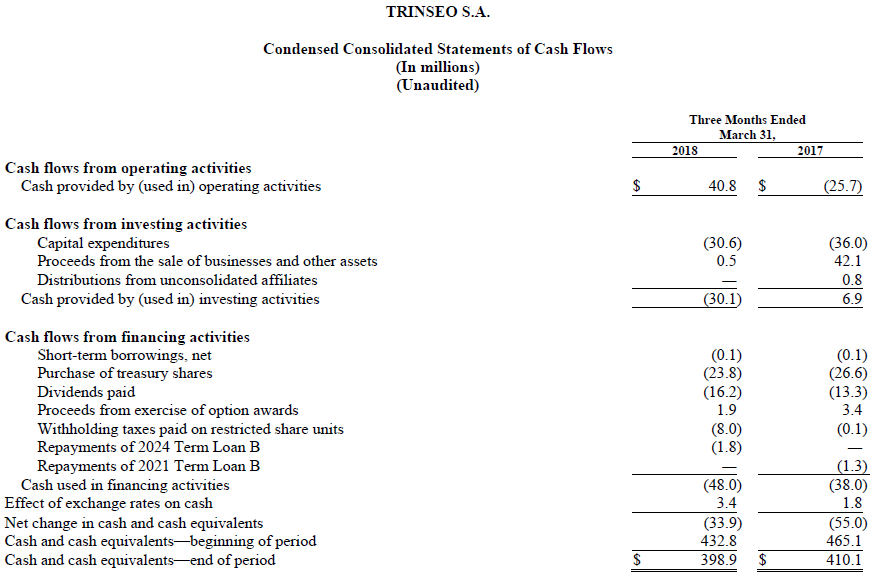
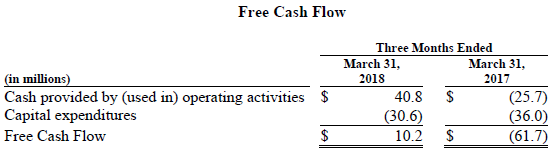
Cash provided by operating activities for the quarter was $41 million and capital expenditures were $31 million, resulting in Free Cash Flow for the quarter of $10 million. First quarter cash from operations and Free Cash Flow included approximately $105 million of higher working capital primarily from increasing sales and raw material prices as well as higher inventory levels ahead of second quarter planned maintenance. At the end of the quarter, the Company had $399 million of cash which reflected $24 million of share repurchases during the quarter. For a reconciliation of Free Cash Flow to cash provided by (used in) operating activities, see note 3 below.
Outlook
Commenting on the outlook for the second quarter and full year 2018 Pappas said, “We expect continued strong performance in the second quarter. Styrene margins have remained healthy to start the quarter and business fundamentals remain solid which should lead to robust profitability in the first half of the year.”
Pappas continued, “Looking ahead to the full year performance, we are raising our 2018 net income and Adjusted EBITDA guidance. This outlook includes solid performance across the portfolio. In addition, we continue to expect strong cash generation for the year and remain focused on the right balance of growth and returning cash to shareholders."
For a reconciliation of second quarter and full year 2018 net income to Adjusted EBITDA and Adjusted EPS, see note 2 below. Additionally, refer to the appendix within Exhibit 99.3 of our Form 8-K, dated May 2, 2018, for further details on how net timing impacts are defined and calculated for our segments.
Conference Call and Webcast Information
Trinseo will host a conference call to discuss its first quarter 2018 financial results on Thursday, May 3, 2018 at 10 AM Eastern Time.
Commenting on results will be Chris Pappas, President and Chief Executive Officer, Barry Niziolek, Executive Vice President and Chief Financial Officer, and David Stasse, Vice President, Treasury and Investor Relations. The conference call will be available by phone at:
Participant Toll-Free Dial-In Number: +1 866-393-4306
Participant International Dial-In Number: +1 734-385-2616
Conference ID: 6757049
The Company will also offer a live Webcast of the conference call with question and answer session via the registration page of the Trinseo Investor Relations website.
Trinseo has posted its first quarter 2018 financial results on the Company’s Investor Relations website. The presentation slides will also be made available in the webcast player prior to the conference call. The Company will also furnish copies of the financial results press release and presentation slides to investors by means of a Form 8-K filing with the U.S. Securities and Exchange Commission.
A replay of the conference call and transcript will be archived on the Company’s Investor Relations website shortly following the conference call. The replay will be available until May 3, 2019.
TRINSEO S.A.
Notes to Condensed Consolidated Financial Information
(Unaudited)
Note 1: Net sales by Segment*
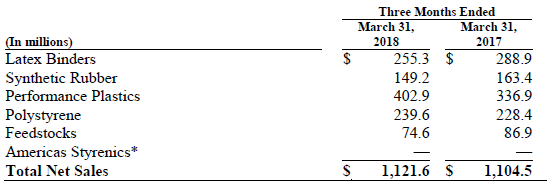
The results of this segment are comprised entirely of earnings from Americas Styrenics, our 50%-owned equity method investment. As such, we do not separately report net sales of Americas Styrenics within our condensed consolidated statement of operations.
Note 2: Reconciliation of Non-GAAP Performance Measures to Net income
EBITDA is a non-GAAP financial performance measure that we refer to in making operating decisions because we believe it provides our management as well as our investors with meaningful information regarding the Company’s operational performance. We believe the use of EBITDA as a metric assists our board of directors, management and investors in comparing our operating performance on a consistent basis.
We also present Adjusted EBITDA as a non-GAAP financial performance measure, which we define as income from continuing operations before interest expense, net; income tax provision; depreciation and amortization expense; loss on extinguishment of long-term debt; asset impairment charges; gains or losses on the dispositions of businesses and assets; restructuring charges; acquisition related costs and other items. In doing so, we are providing management, investors, and credit rating agencies with an indicator of our ongoing performance and business trends, removing the impact of transactions and events that we would not consider a part of our core operations.
Lastly, we present Adjusted Net Income and Adjusted EPS as additional performance measures. Adjusted Net Income is calculated as Adjusted EBITDA (defined beginning with net income, above), less interest expense, less the provision for income taxes and depreciation and amortization, tax affected for various discrete items, as appropriate. Adjusted EPS is calculated as Adjusted Net Income per weighted average diluted shares outstanding for a given period. We believe that Adjusted Net Income and Adjusted EPS provide transparent and useful information to management, investors, analysts and other stakeholders in evaluating and assessing our operating results from period-to-period after removing the impact of certain transactions and activities that affect comparability and that are not considered part of our core operations.
There are limitations to using the financial performance measures noted above. These performance measures are not intended to represent net income or other measures of financial performance. As such, they should not be used as alternatives to net income as indicators of operating performance. Other companies in our industry may define these performance measures differently than we do. As a result, it may be difficult to use these or similarly-named financial measures that other companies may use, to compare the performance of those companies to our performance. We compensate for these limitations by providing reconciliations of these performance measures to our net income, which is determined in accordance with GAAP.
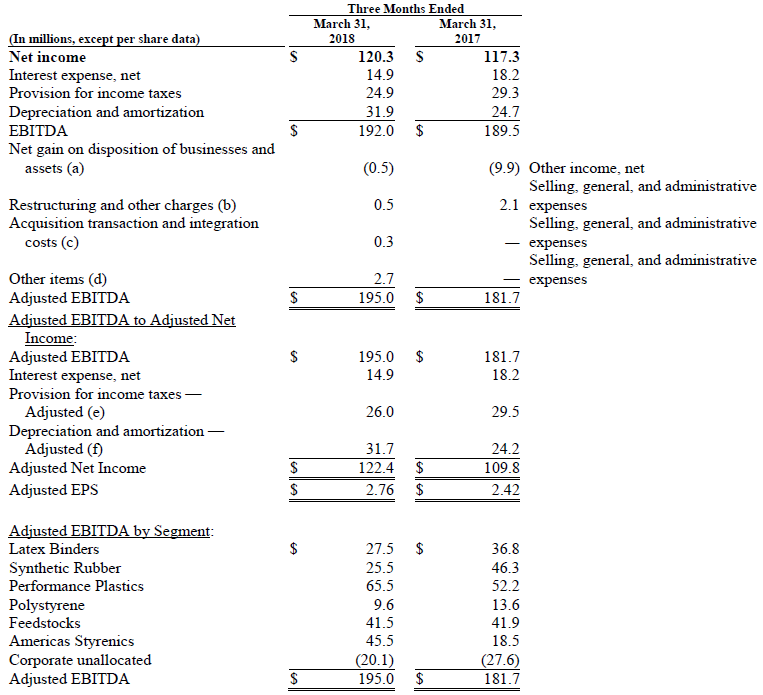
(a) Net gain on disposition of businesses and assets during the three months ended March 31, 2017 relates primarily to the sale of our 50% share in Sumika Styron Polycarbonate to Sumitomo Chemical Company Limited, for which the Company recorded a gain on sale of $9.3 million during the period.
(b) Restructuring and other charges for the three months ended March 31, 2018 and 2017 primarily relate to decommissioning, contract termination, and employee termination benefit charges incurred in connection with the upgrade and replacement of the Company’s compounding facility in Terneuzen, The Netherlands as well as the Company’s decision to cease manufacturing activities at our latex binders manufacturing facility in Livorno, Italy.
Note that the accelerated depreciation charges incurred as part of the upgrade and replacement of the Company’s compounding facility in Terneuzen, The Netherlands are included within the “Depreciation and amortization” caption above, and therefore are not included as a separate adjustment within this caption.
(c) Acquisition transaction and integration costs for the three months ended March 31, 2018 relate to advisory and professional fees incurred in conjunction with the Company’s acquisition of API Plastics.
(d) Other items for the three months ended March 31, 2018 relate to advisory and professional fees incurred in conjunction with the Company’s initiative to transition business services from The Dow Chemical Company, including certain administrative services such as accounts payable, logistics, and IT services.
(e) Adjusted to remove the tax impact of the items noted in (a),(b),(c) and (d). The income tax expense (benefit) related to these items was determined utilizing either (1) the estimated annual effective tax rate on our ordinary income based upon our forecasted ordinary income for the full year, or (2) for items treated discretely for tax purposes, we utilized the applicable rates in the taxing jurisdictions in which these adjustments occurred. Additionally, the three months ended March 31, 2018 excludes a $0.5 million tax benefit recognized during the period related to provision to return adjustments.
(f) For the three months ended March 31, 2018 and 2017 the amounts exclude accelerated depreciation of $0.3 and $0.6 million, respectively related to the upgrade and replacement of the Company’s compounding facility in Terneuzen, The Netherlands.
For the same reasons discussed above, we are providing the following reconciliation of forecasted net income to forecasted Adjusted EBITDA and Adjusted EPS for the three months ended June 30, 2018, as well as for the full year ended December 31, 2018. See “Note on Forward-Looking Statements” above for a discussion of the limitations of these forecasts.
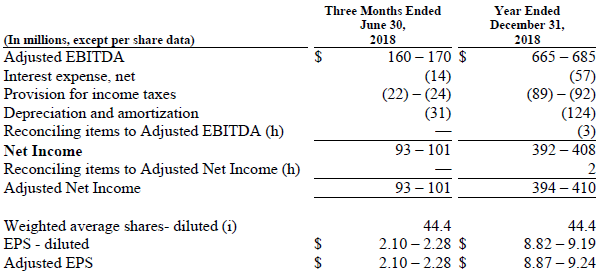
(h) Reconciling items to Adjusted EBITDA and Adjusted Net Income are not typically forecasted by the Company based on their nature as being primarily driven by transactions that are not part of the core operations of the business. As such, for the forecasted three months ended June 30, 2018 and full year ended December 31, 2018, we have not included estimates for these items.
(i) Weighted average shares calculated for the purpose of forecasting Adjusted EPS do not forecast significant future share transactions or events, such as repurchases, significant stock-based compensation award grants, and changes in the Company’s share price. These are all factors which could have a significant impact on the calculation of Adjusted EPS during actual future periods.
Note 3: Reconciliation of Non-GAAP Liquidity Measures to Cash from Operations
The Company uses Free Cash Flow to evaluate and discuss its liquidity position and results. Free Cash Flow is defined as cash from operating activities, less capital expenditures. We believe that Free Cash Flow provides an indicator of the Company’s ongoing ability to generate cash through core operations, as it excludes the cash impacts of various financing transactions as well as cash flows from business combinations that are not considered organic in nature. We also believe that Free Cash Flow provides management and investors with a useful analytical indicator of our ability to service our indebtedness, pay dividends (when declared), and meet our ongoing cash obligations.
Free Cash Flow is not intended to represent cash flows from operations as defined by GAAP, and therefore, should not be used as an alternative for that measure. Other companies in our industry may define Free Cash Flow differently than we do. As a result, it may be difficult to use this or similarly-named financial measures that other companies may use, to compare the liquidity and cash generation of those companies to our own. The Company compensates for these limitations by providing the reconciliation below, which is determined in accordance with GAAP.
Corporate News
Trinseo’s Chuck Fifelski Discusses EIFS & Stucco Applications in Walls & Ceilings Magazine
April 16, 2024
Corporate News
Trinseo Announces Release Date and Conference Call for its First Quarter 2024 Financial Results
April 11, 2024
Corporate News
Trinseo Introduces Groundbreaking Flame-retardant Plastic Grades Without Using PFAS Additives During Manufacturing Process
April 09, 2024